Getting Started with Tableau
Tableau Software is a powerful data visualization tool that has gained popularity in the BI industry. It is used to transform raw sets of data into a format that is easily understandable. It is also used for managing metadata. The good news is that you require zero technical skills and coding knowledge in order to make use of Tableau.
Before getting you started on Tableau, it is important to answer the question, ‘Why is data visualization important?’

Data visualization is important because the human brain easily understands things that are visually descriptive. Data visualization, therefore, helps people understand data better since the data is produced in ‘doses’ of easily digestible visuals. Besides, nicely designed graphics are a great way to present data.
We shall review how to get started with Tableau and get the best out of it.
App Download and Installation
Tableau for Students
Tableau has a Tableau for Students Program through which students enrolled in an accredited institution can acquire the Tableau Student License for one year. This is done upon the submission of academic details. The student is required to submit the form anew every year to renew the license.
You can download Tableau for Students here.
Tableau Public
This is a free data visualization software through which anyone can publicly share data visualizations online. Any person can connect to a spreadsheet or file and create interactive data visualizations.
You can download Tableau Public software view this link.
Tableau for Professionals
Tableau offers a plethora of Tableau products to take care of your business needs. This service has a free trial.
Tableau has five main products that appeal to the needs of organizations and professionals. These products are;
· Tableau Server- Gives room for collaboration
· Tableau Desktop- For individual use
· Tableau Online- Cloud business intelligence
· Tableau Public- For publishing interactive data online
· Tableau Reader- Allows one to read data saved in Tableau Desktop
Starting Off on Tableau
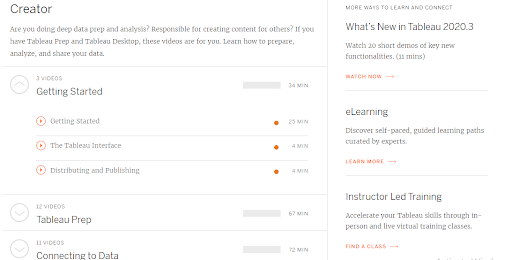
The best way to start using Tableau is by joining their training programs. Tableau offers Live, Free Online, and Classroom training programs. The available videos provide you with all the information and sets of data you need.
In order to access these videos, you first need to register. You can find the three videos in the ‘Getting Started’ section. The first video is Getting Started which runs for 25 minutes, the second one is The Tableau Interface that runs for about 4 minutes while the last one is Distribution and Publishing which is 4 minutes long.
The training videos will show you how to carry out data preparation, how to build views, ways to distribute data, and how to connect with data.
Connecting with Data Sources
Tableau can connect with a wide range of data sources, from texts to databases, to even big data.
The ‘Connecting to Data’ section of Tableau’s training programs has 11 videos that are cumulatively 72 minutes long. They contain explanations of basic and advanced features of data connectivity. The main aspects covered are Connecting to Cubes, Data Blending, Join Types, Google Analytics, Custom SQL, and Managing Metadata.
Visual Analytics
With Tableau, you will get various options to represent data in various views, to apply filters, to forecast, and to apply drill-downs.
Now that you already have an idea of data visualization, the next hurdle you will have to cross is choosing the object you will use to represent your data.
This should not be a big problem with Tableau since it has an ‘automatic selection of views’ feature that will choose for you and activate the best view given the dimensions and measures.
In the Visual Analytics section, you will come across important sections such as Drill Down and Hierarchies, Grouping, and Forecasting.
Time to Practice and Join Tableau Communities
Now that you have reviewed various objects, learned data connectivity, and looked at the creation of views in Tableau, it is time to gather all that and see what comes out of them. Practice using different visualization methods on data.
Practice will soon make you perfect!
Another thing that will tremendously enhance your learning is by joining Tableau communities. You will be able to ask questions that will be answered by people who have the knowledge.
Data visualization can be complex, but when you are part of a community, you can access simplified explanations, descriptions, and procedures.
A notable community you can consider joining is the Tableau Community which has forums, groups, and a workbook library. Learning is enhanced because you can get your questions answered faster than you can say the word ‘Tableau’. You can also subscribe to Tableau blogs, as well as lookup Tableau-associated social media groups (Facebook, LinkedIn, etc.). The Facebook page Tableau Software enjoys the followership of many Tableau enthusiasts.

Making Advance Expressions and Data Visualization
Had enough milk and weaned a little? It is now time to chew some bones; soft ones I promise. You can start creating calculated expressions in order to develop a new visualization beyond the available measures and dimensions.
These expressions may be based on mathematical ideas, dates, text expressions, among others.
You can also start making advanced visualization. By manipulating the objects, you can generate advanced visualization and charts. Advanced visualization methods include Bump Charts, Histograms, Box Plots, Funnel Charts, and Pareto Charts.
Tableau Server and Online
It is the duty of the Tableau administrator to ensure data security by scheduling tasks and providing authorization. However, it is important for you to understand both the Tableau Server and Tableau Online to facilitate dashboard development.
In Conclusion
Now that you have mastered all that you need in order to create a good visualization, it is time to practice. When you get tired of practicing, practice again! This is the only sure way you will grasp the vital concepts, master the advanced visualization methods, and feel comfortable working around Tableau.
If you feel there are concepts you haven’t mastered yet, go back to the online training programs and review that concept until you are satisfied you’ve got it at the tip of your fingers!